


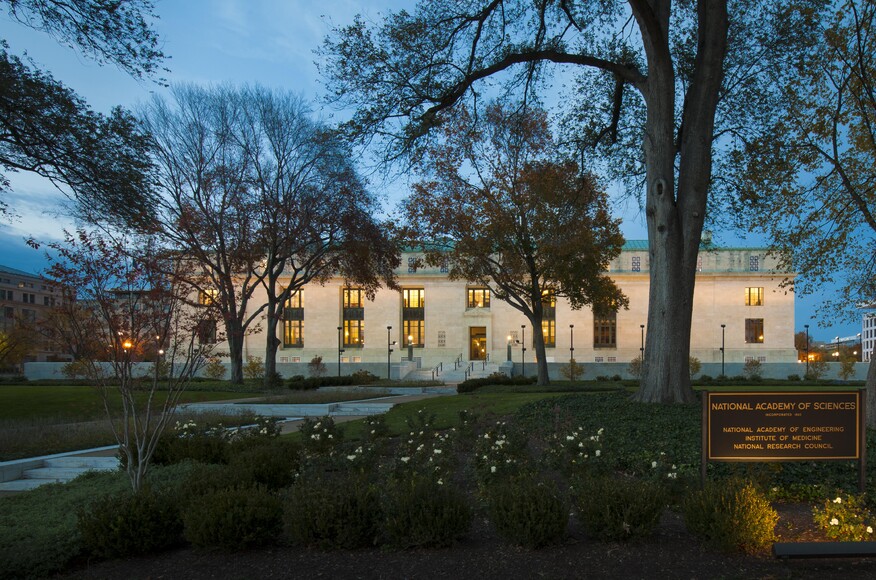
The National Academy of Sciences (NAS) is a United States nonprofit, non-governmental organization. NAS is part of the National Academies of Sciences, Engineering, and Medicine, along with the National Academy of Engineering (NAE) and the National Academy of Medicine (NAM).
As a national academy, new members of the organization are elected annually by current members, based on their distinguished and continuing achievements in original research. Election to the National Academy is one of the highest honors in the scientific field. Members of the National Academy of Sciences serve pro bono as "advisers to the nation" on science, engineering, and medicine. The group holds a congressional charter under Title 36 of the United States Code.
Founded in 1863 as a result of an Act of Congress that was approved by Abraham Lincoln, the NAS is charged with "providing independent, objective advice to the nation on matters related to science and technology. … to provide scientific advice to the government 'whenever called upon' by any government department."[2]
The Academy receives no compensation from the government for its services.[3]
The Academy currently has 2,984 members and international members. Existing members elect new members for life. Up to 120 members are elected every year; up to 30 foreign citizens may be elected as international members annually. The election process begins with a formal nomination, followed by a vetting period, and culminates in a final ballot at the Academy's annual meeting in April each year. Members are affiliated with a section -- a specific scientific field -- in one of six so-called "classes": (1) Physical and Mathematical Sciences; (2) Biological Sciences; (3) Engineering and Applied Sciences; (4) Biomedical Sciences; (5) Behavioral and Social Sciences; and (6) Applied Biological, Agricultural, and Environmental Sciences.[6] Since its founding, the Academy has elected 6,457 members. Harvard University is associated with the most members (329), some 5% of the all-time total. The top ten institutions, half of which are Ivy League universities, account for nearly 28% of all members ever elected.[11]
| Top 10 Primary Institutions | Members (1963-2022) |
|---|---|
| Harvard University | 329 |
| Stanford University | 250 |
| University of California, Berkeley | 242 |
| Massachusetts Institute of Technology | 206 |
| Yale University | 132 |
| Princeton University | 128 |
| California Institute of Technology | 126 |
| Columbia University | 125 |
| University of Chicago | 120 |
| University of Pennsylvania | 83 |
A college endowment refers to all the money that an institution receives in donations. However, endowment funds are not ‘no-questions-asked’ cash boosts for the college. Instead, endowments are tightly controlled investments that are supposed to be grown so that the interest can be used to upgrade facilities, hire new staff, provide scholarships or aid the college or its students in some way.
Over the past three decades, the total market value of the 20 largest college endowments has grown nearly tenfold — from $30.6 billion to $302.1 billion. As the size of college endowments has increased, so too has the debate over their purpose, management and ethical obligations.
To get a better idea of how college endowments have changed over the last 30 years, DegreeQuery looked at the market value of the 20 largest U.S. college endowments from 1990 to 2020.
30 Years of U.S. college endowments
Based on the most recent NACUBO survey of 810 universities, the total market value of endowments in 2018 was $624.3 billion. 48.3% of that is held by just 20 colleges. But why the huge growth in market value over the past 30 years? It might be something to do with how much of the endowment the university chooses to spend on operations or the return rates of the endowment’s investment portfolio. Due to their often wealthy donor base and long-term investment horizons, the largest university endowments can invest in a diverse array of asset classes, and often grow faster than the economy as a whole.
From 1990 to 2020, the market value of the 20 largest college endowments grew at an average annual rate of 8.5% — faster than the 6.6% average annual growth rate for the Fortune 500 over the same period. The universities with the fastest growth over the past 30 years include the University of Michigan, Duke University and the University of Notre Dame. Meanwhile, the endowments with the slowest growth include Emory University, Rice University and Washington University in St. Louis.
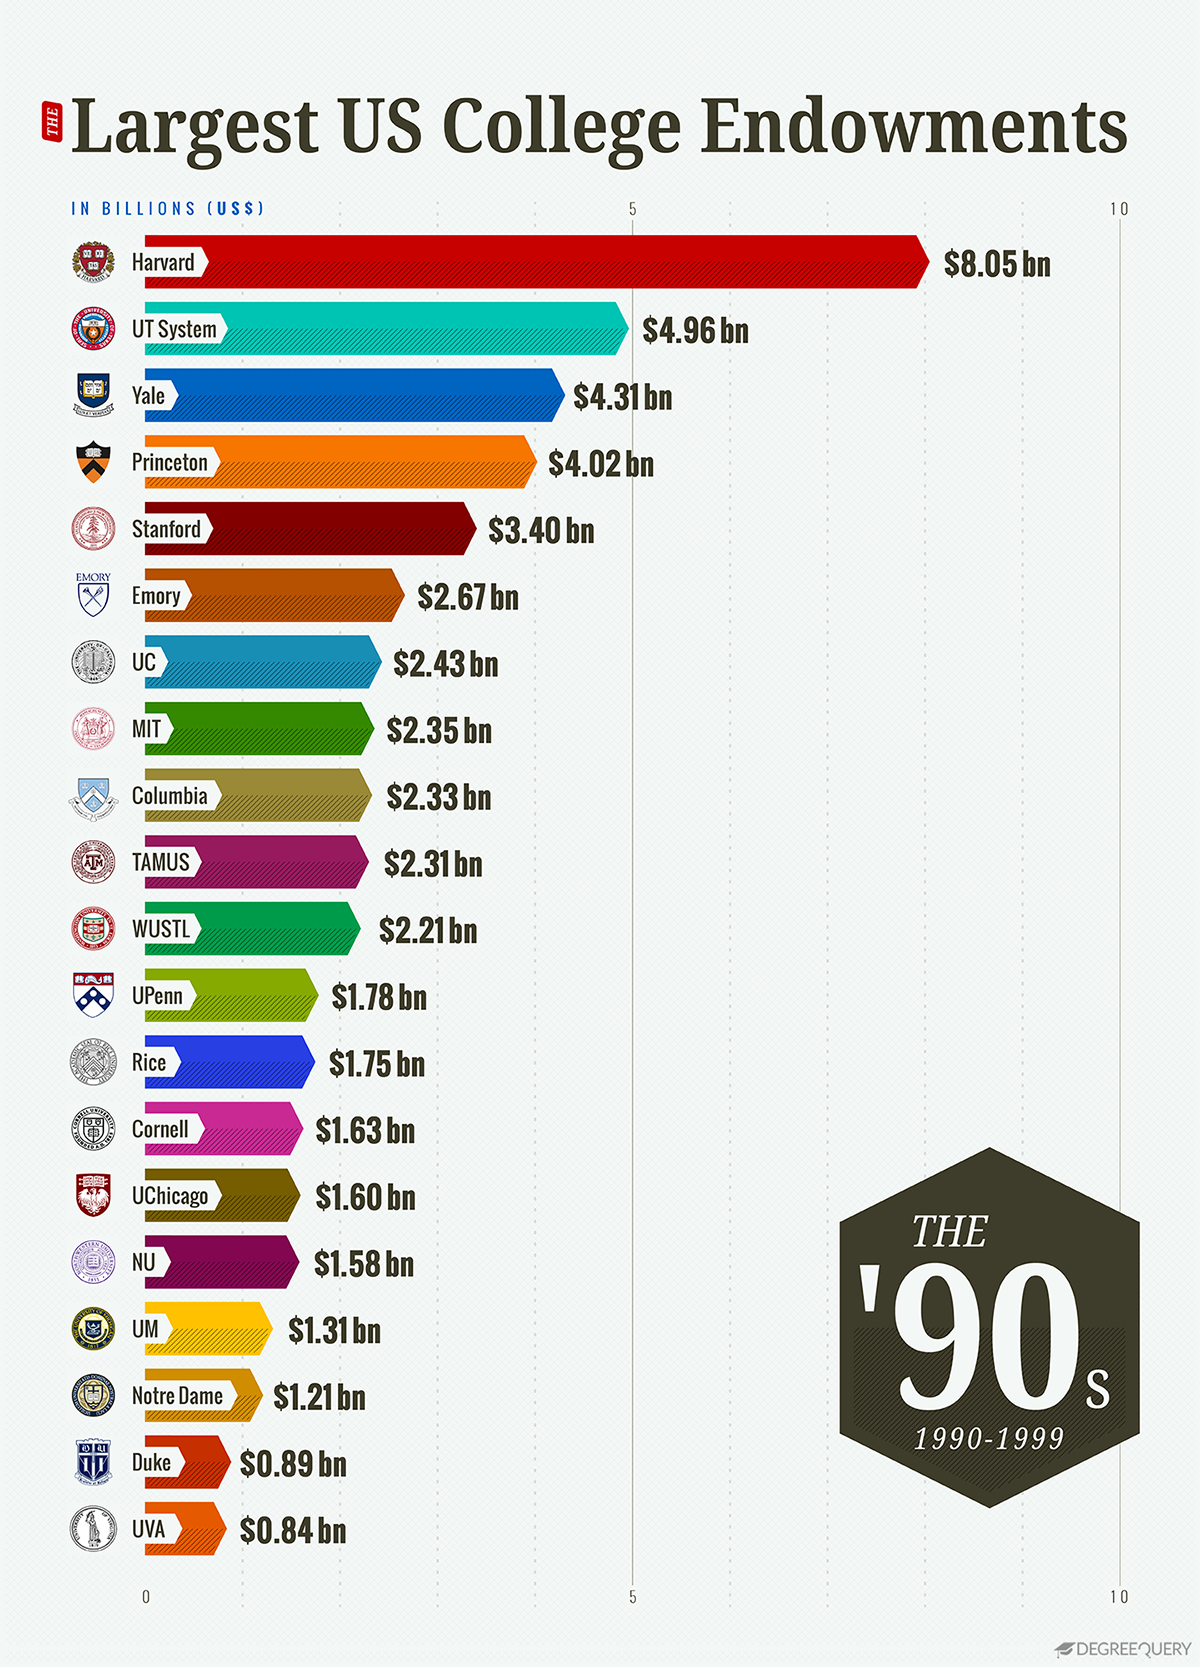
1. U.S. college endowments in the 1990s
From 1990 to 1999, the market value of the 20 largest U.S. college endowments grew at an average annual rate of 12.5% — the fastest of the last three decades. As you can see from our graph, over this period, the University of Michigan endowment rose from the 20th largest to the 17th largest, and the University of Pennsylvania rose from the 16th largest to the 12th largest. Meanwhile, the Columbia University endowment fell from the sixth-largest to the 11th largest. Although the University of Texas System endowment had the slowest growth of the 20 largest endowments over this period, it remained the second-largest endowment overall.
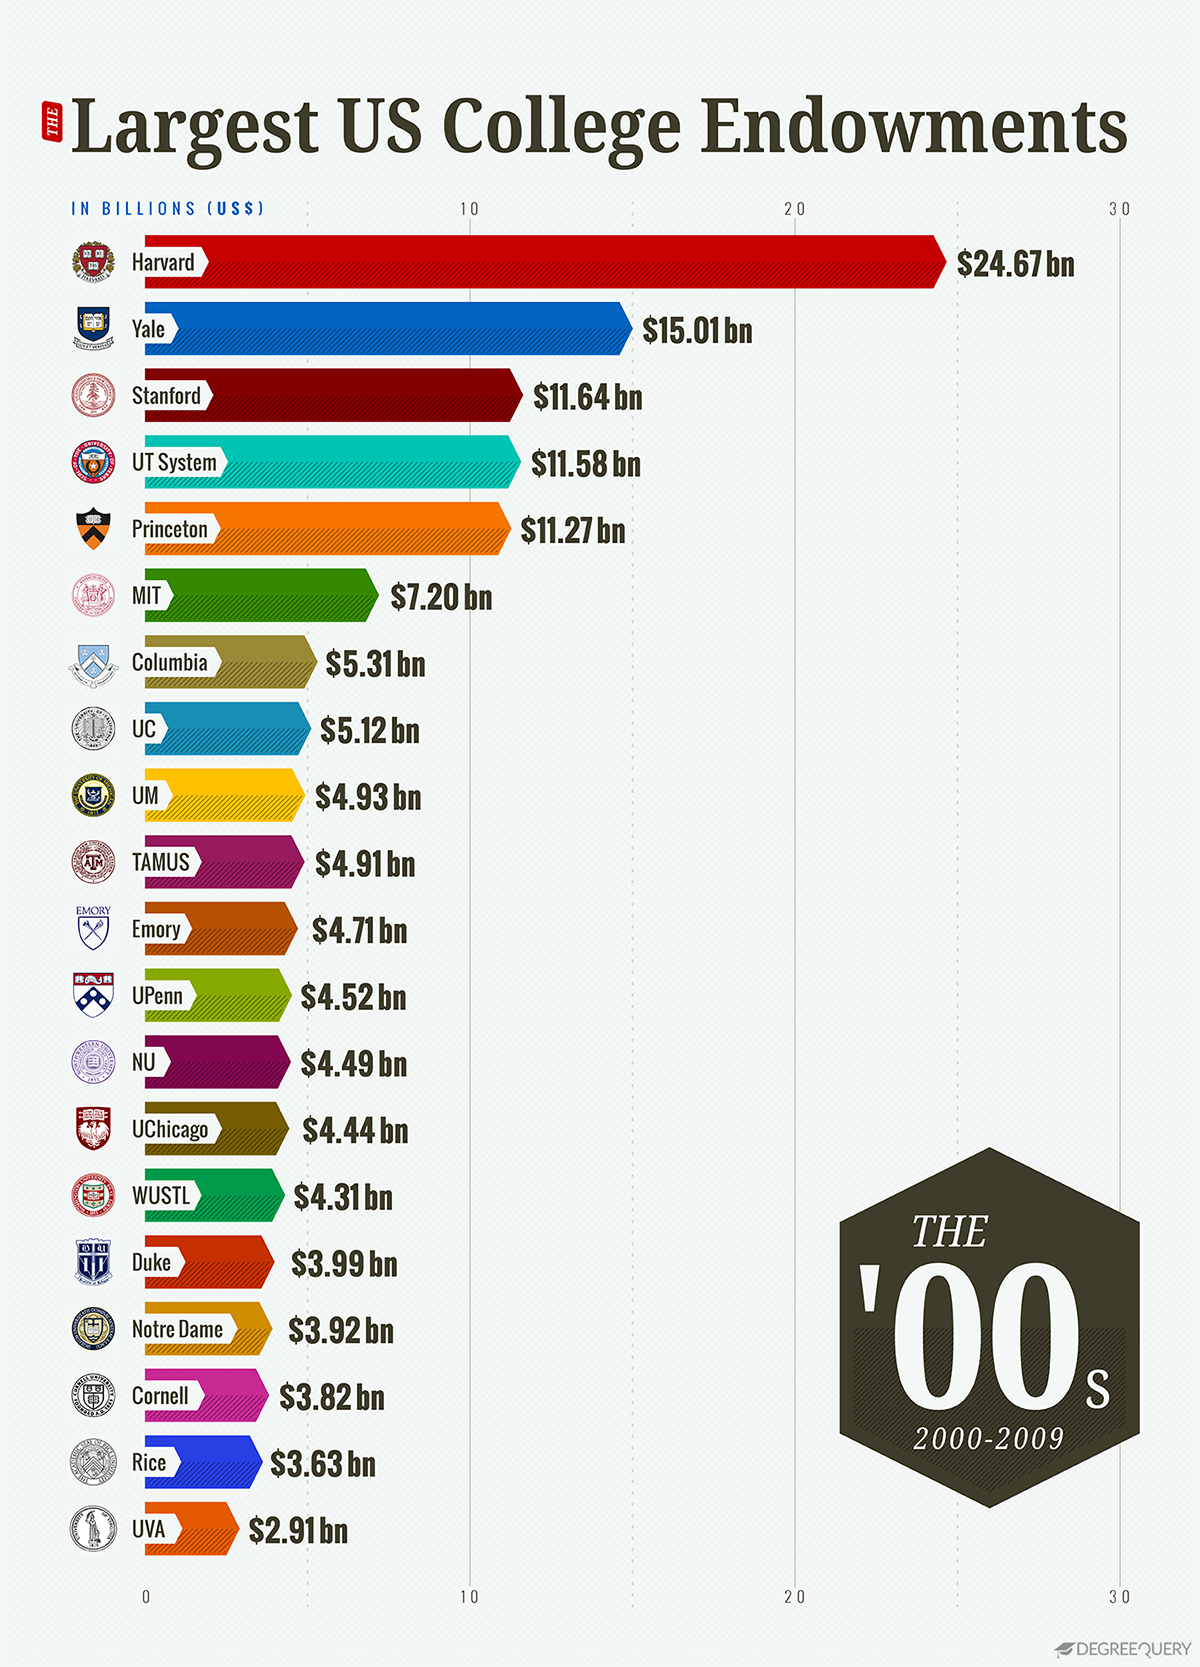
2. U.S. college endowments in the 2000s
Endowment growth is closely connected with the overall health of the economy. As of 2018, just 4% of endowment assets were held as cash, the rest invested in equities, fixed income instruments and alternative investment vehicles. In the lead up to the 2008 financial crisis — university endowments had increasingly invested in high-risk, illiquid investments like private equity, real estate and hedge funds. As a result, endowments lost tens of billions of dollars in value, with some schools losing more than 25% of their total endowment value. From 2008 to 2009, the total value of the 20 largest endowments fell 3.4%. Yale posted the largest percentage decline, losing 28.6% of its market value. Other university endowments that posted big losses from the recession include Harvard, Duke and Stanford.
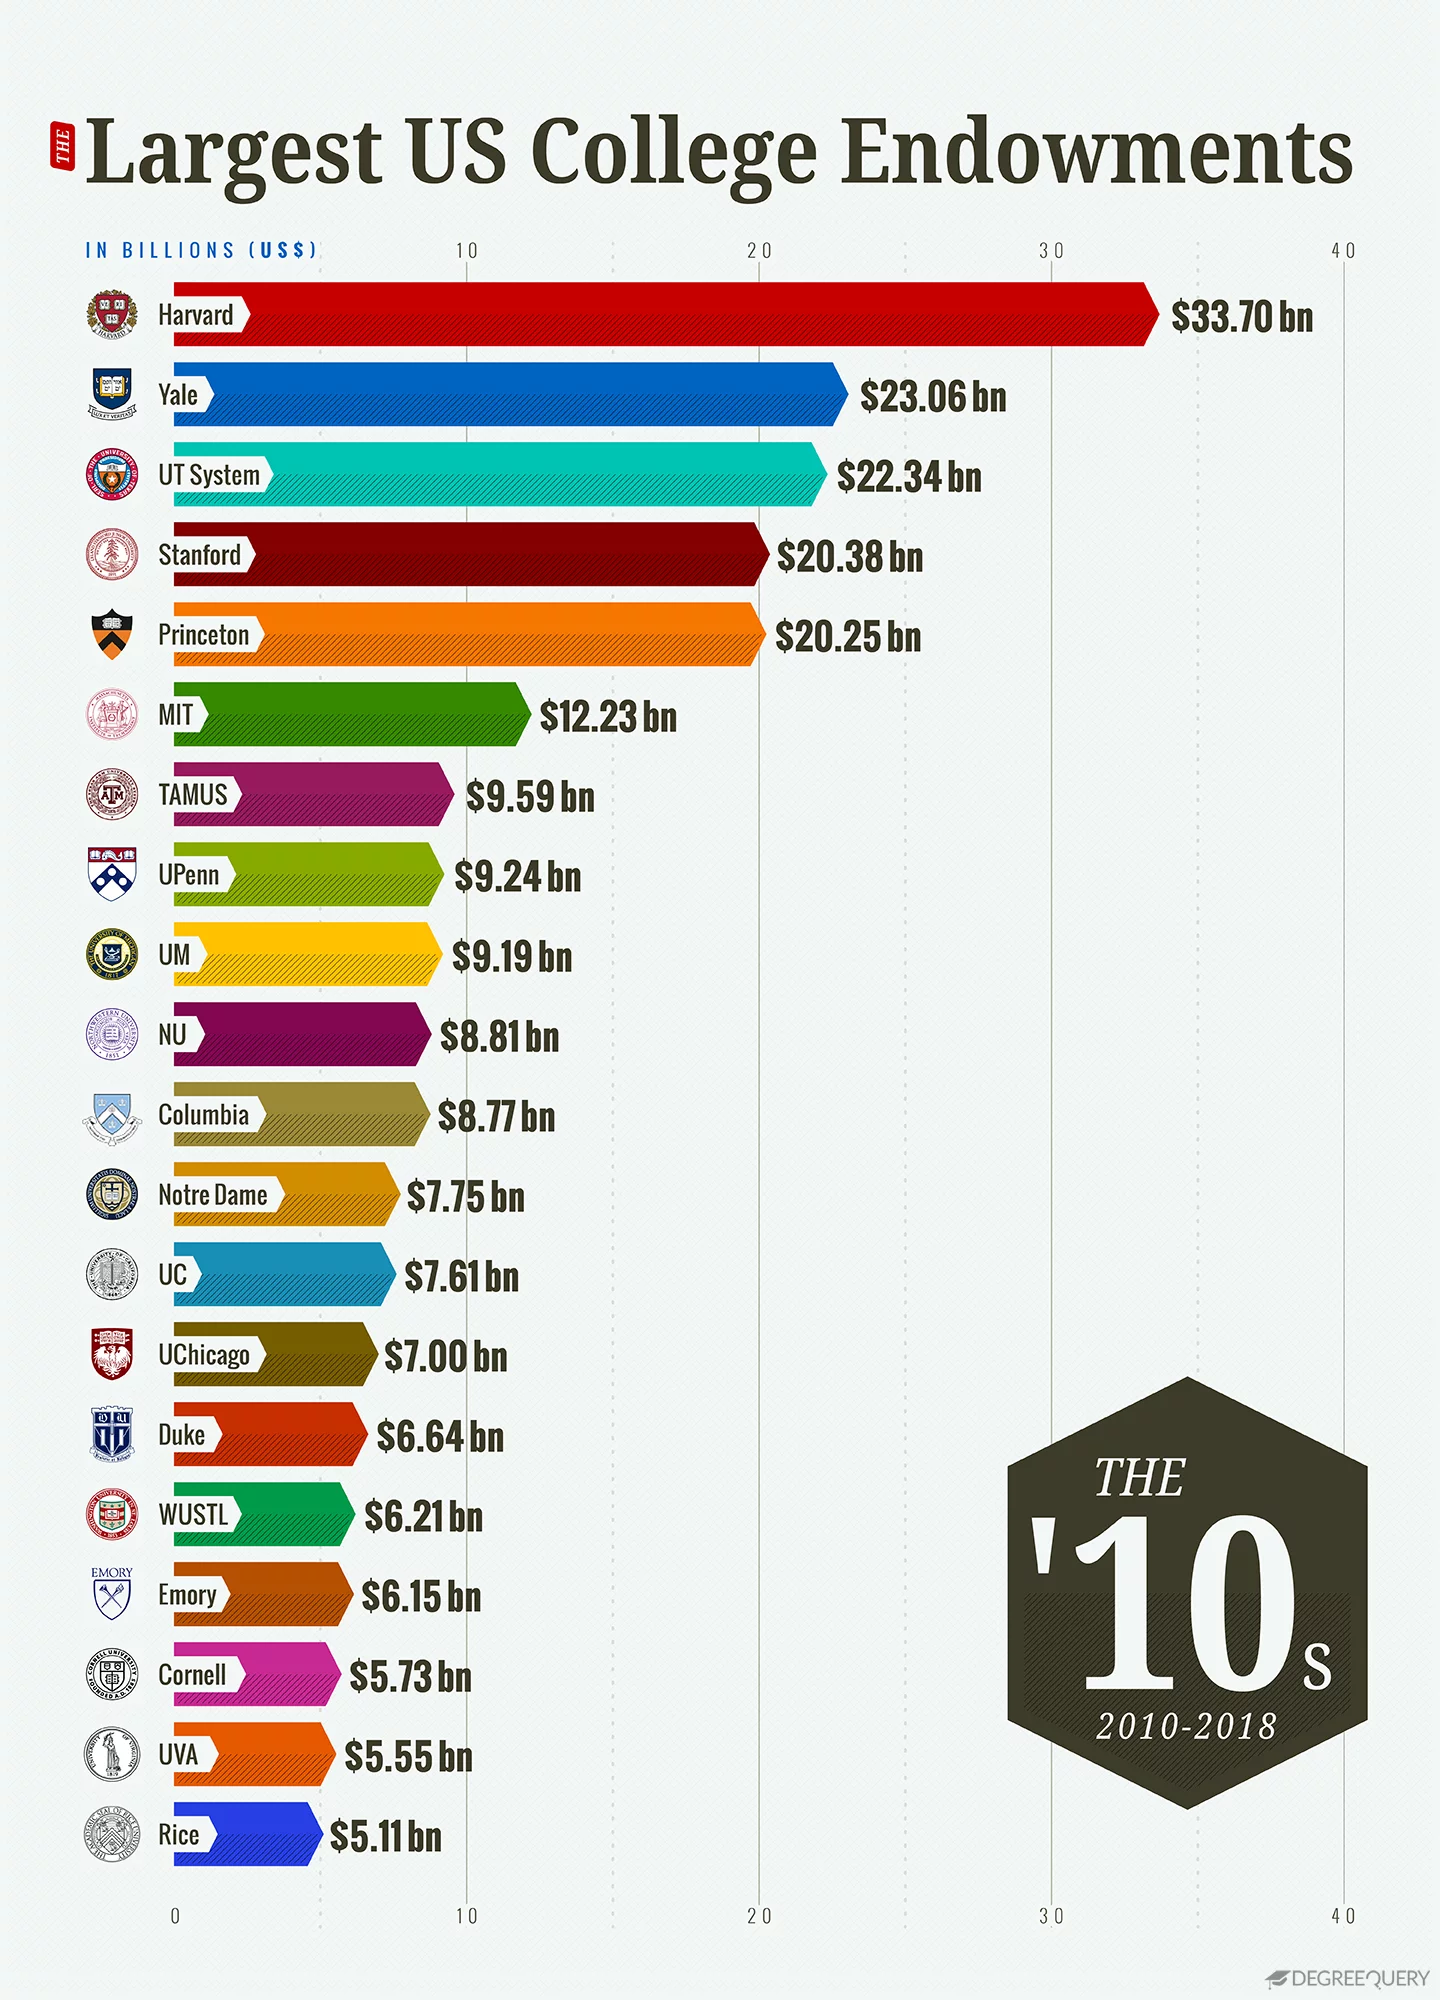
3. U.S. college endowments in the 2010s
Endowment growth rates rebounded in the wake of the Great Recession, although growth was still slow compared to the 1990s. From 2010 to 2018, the market value of the 20 largest endowments grew at an average annual rate of 7.6%. This is more than the 3.5% average annual growth rate for 2000 to 2009, yet less than the 12.5% rate for 1990 to 1999. During this period, the biggest winners were the University of Pennsylvania, rising from 11th to 7th largest, and the Texas A&M University System, which rose from 10th to 8th largest. Lackluster performance at some of the wealthiest schools has prompted some universities to make major changes to their endowment management. In 2017, for example, Harvard announced it would lay off roughly half of its 230-person staff in the wake of poor investment performance.

As you can see, university endowments were big business over the past 30 years. Nowadays, students, policymakers and the general public are increasingly involved in the conversation surrounding their management, mission and societal impact. For example, the 2017 Tax Cuts and Jobs Act, which imposed a 1.4% tax on the net investment income of the wealthiest endowments, recently sparked a wave of criticism from university administrators. Elsewhere on campus, protesting students demanded their universities divest from fossil fuel companies.
As the debate rages on and endowments continue to grow, these visualizations help us see how we got to this point.
Methodology
To get a better idea of how college endowments have changed over the last 30 years, DegreeQuery looked at the market value of the 20 largest U.S. college endowments from 1990 to 2018. Data on endowment asset value by university came from the National Association of College and University Business Officers (NACUBO) and is unadjusted for inflation. In years when certain universities did not participate in the NACUBO survey, we estimated the endowment value based on the compound annual growth rate for all available years. Estimated figures include the market value of the endowment assets for the Texas A&M University System for 1990, as well as the market value of the endowment assets for the University of California system for the years 1990 through 1992.
SOURCES
Fortune 500. (n.d.) Fortune 500 2018. fortune.com
NACUBO. (2019). Detailed Asset Allocations for U.S. College and University Endowments and Affiliated Foundations, FY18. nacubo.org
Miller, C. & Fabrikant, G. (2008). Universities retrench as endowments suffer from financial crisis. nytimes.com
Humphreys, J. et al. (2010). Educational Endowments and the Financial Crisis: Social Costs and Systemic Risks in the Shadow Banking System. tellus.org
Plender, J. (2014). There is a history lesson to be learnt from Yale endowment. ft.com
Fabrikant, G. (2017). Harvard Makes Changes in Managing a Lagging Endowment. nytimes.com
Tax Policy Center. (n.d.). What is the tax treatment of college and university endowments? taxpolicycenter.org

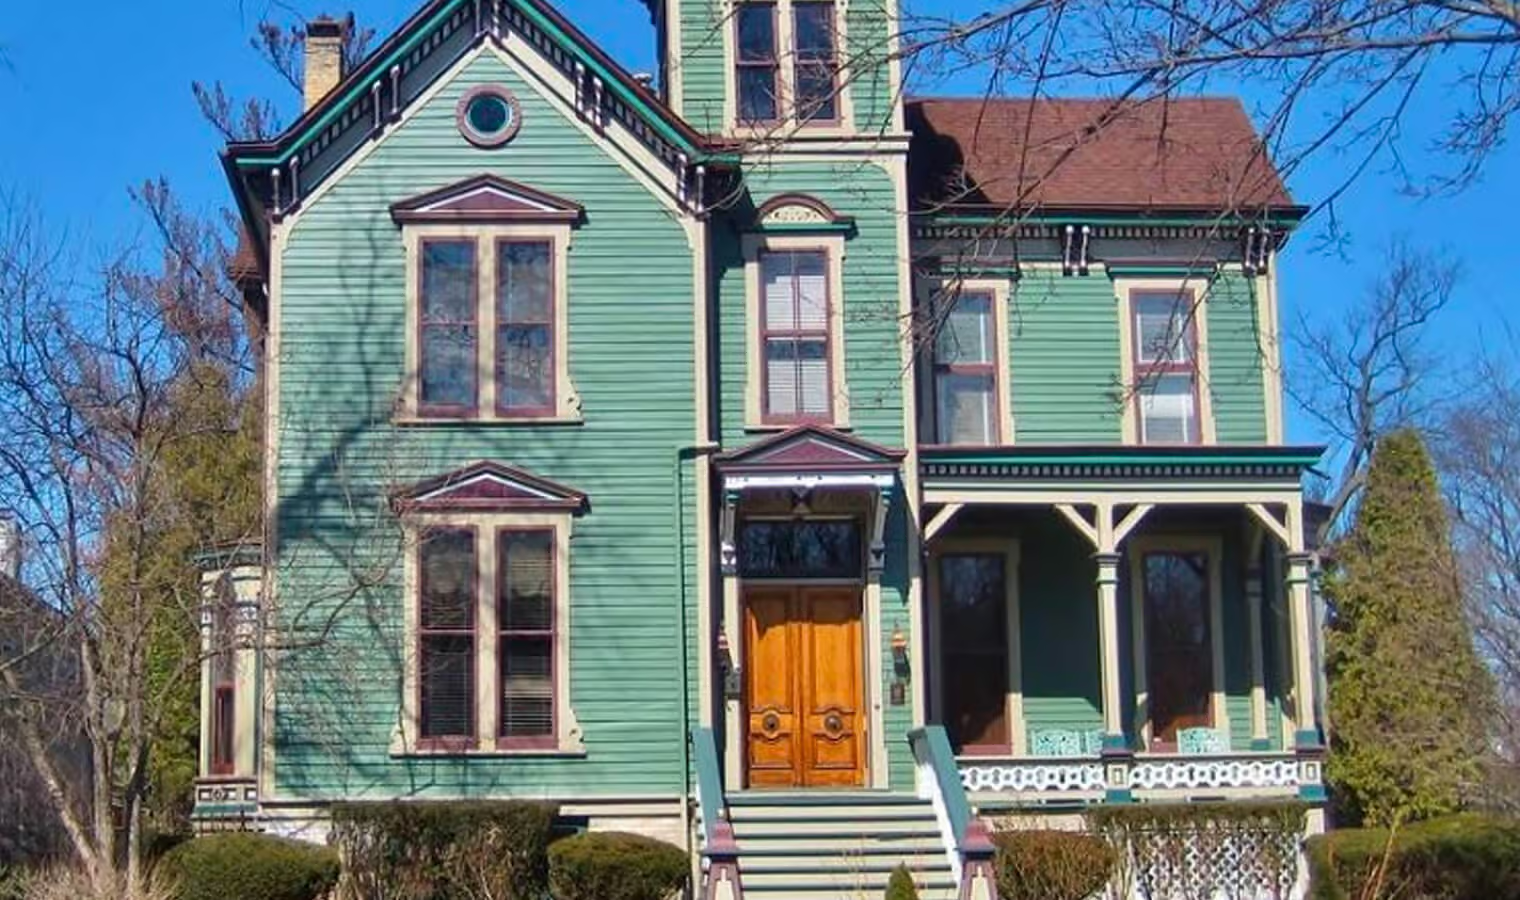
Second Empire homes were a modern Victorian-era style that started in France before spreading through the Northeastern and Midwestern United States. Second Empire architecture features similar ornate Victorian trends, though generally offers a simplified Victorian aesthetic.
These elements help identify a Second Empire home:
- Uniquely shaped Mansard Roof
- Decorative window framing and dormers
- Decorative rails or balustrades around terraces and staircases
- Iron roof crest and eaves with support brackets
Second Empire homes are also easy to identify since they’re the only Victorian-era style that often features a symmetrical, rectangular floor plan.


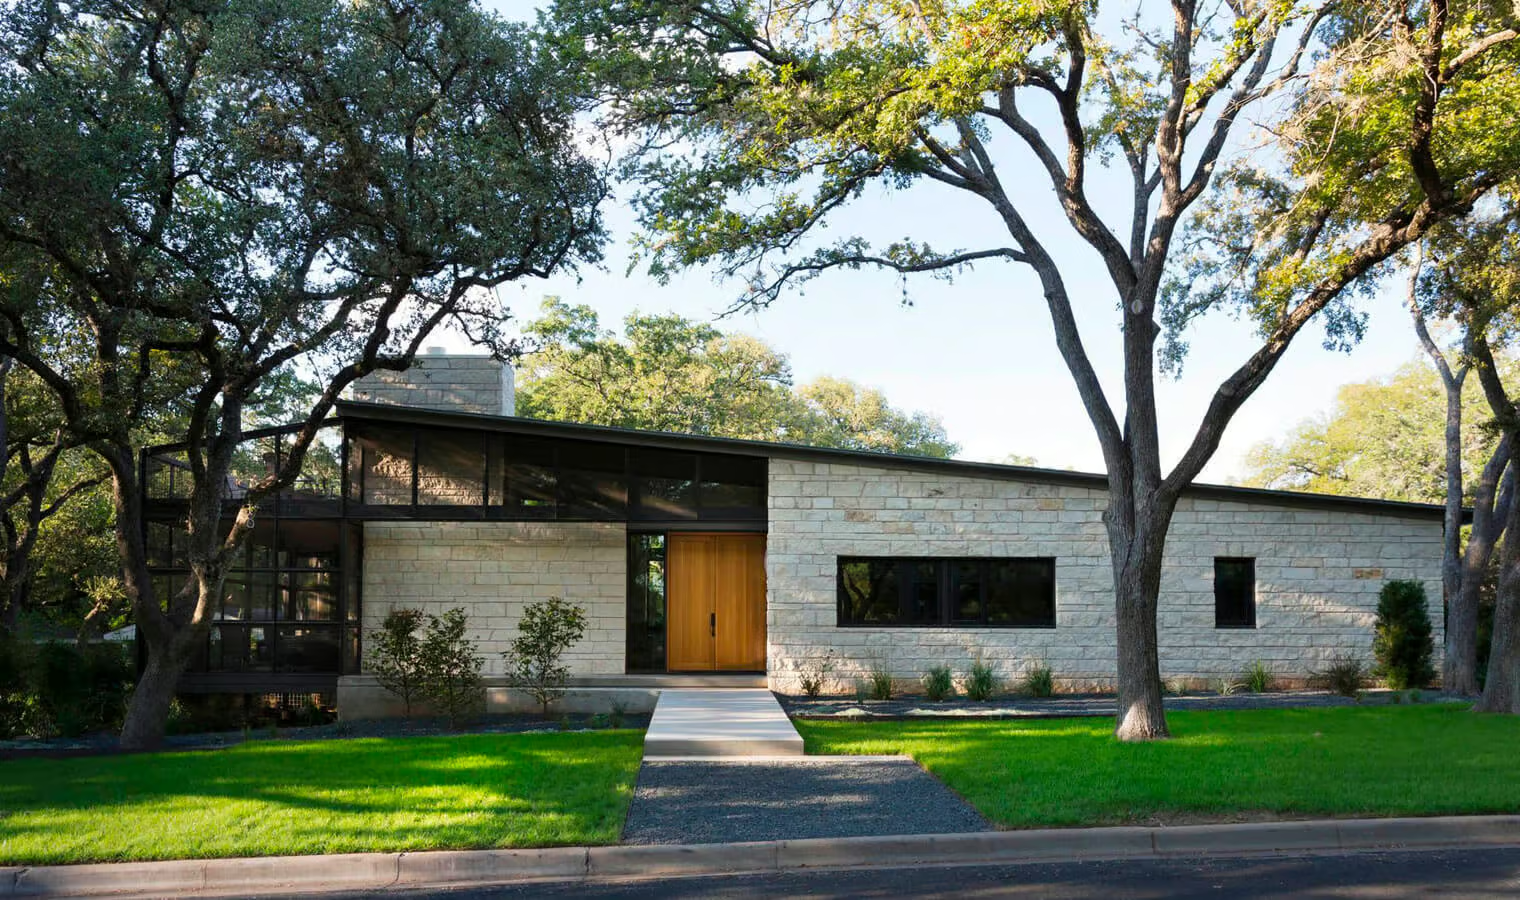
Mid-century Modern designs are nothing new and have influenced interior design, graphic art, and house styles. Mid-century Modern homes are designed to embrace minimalism and nature. They’re also often modeled to appeal to a futuristic or abstract concept.
Mid-century Modern homes can be identified by their:
- Flat planes and clean lines
- Monochromatic brickwork
- Asymmetrical home layouts
- Nature-inspired interior
- Interior level shifts between rooms
Mid-century architecture is still widely popular today, as are Mid-century Modern interior design and furniture trends.

Modern home design became popular in the early 20th century and has a heavy influence on today’s contemporary designs. The core of modern designs can be seen in their:
- Use of geometric shapes
- Large, floor-to-ceiling windows
- Clean lines and flat roofs
- Open floor plans
These styles attempt to connect with nature through minimalism and fluid design between outdoor and indoor spaces. Modern house styles branch into a few key sub-styles.

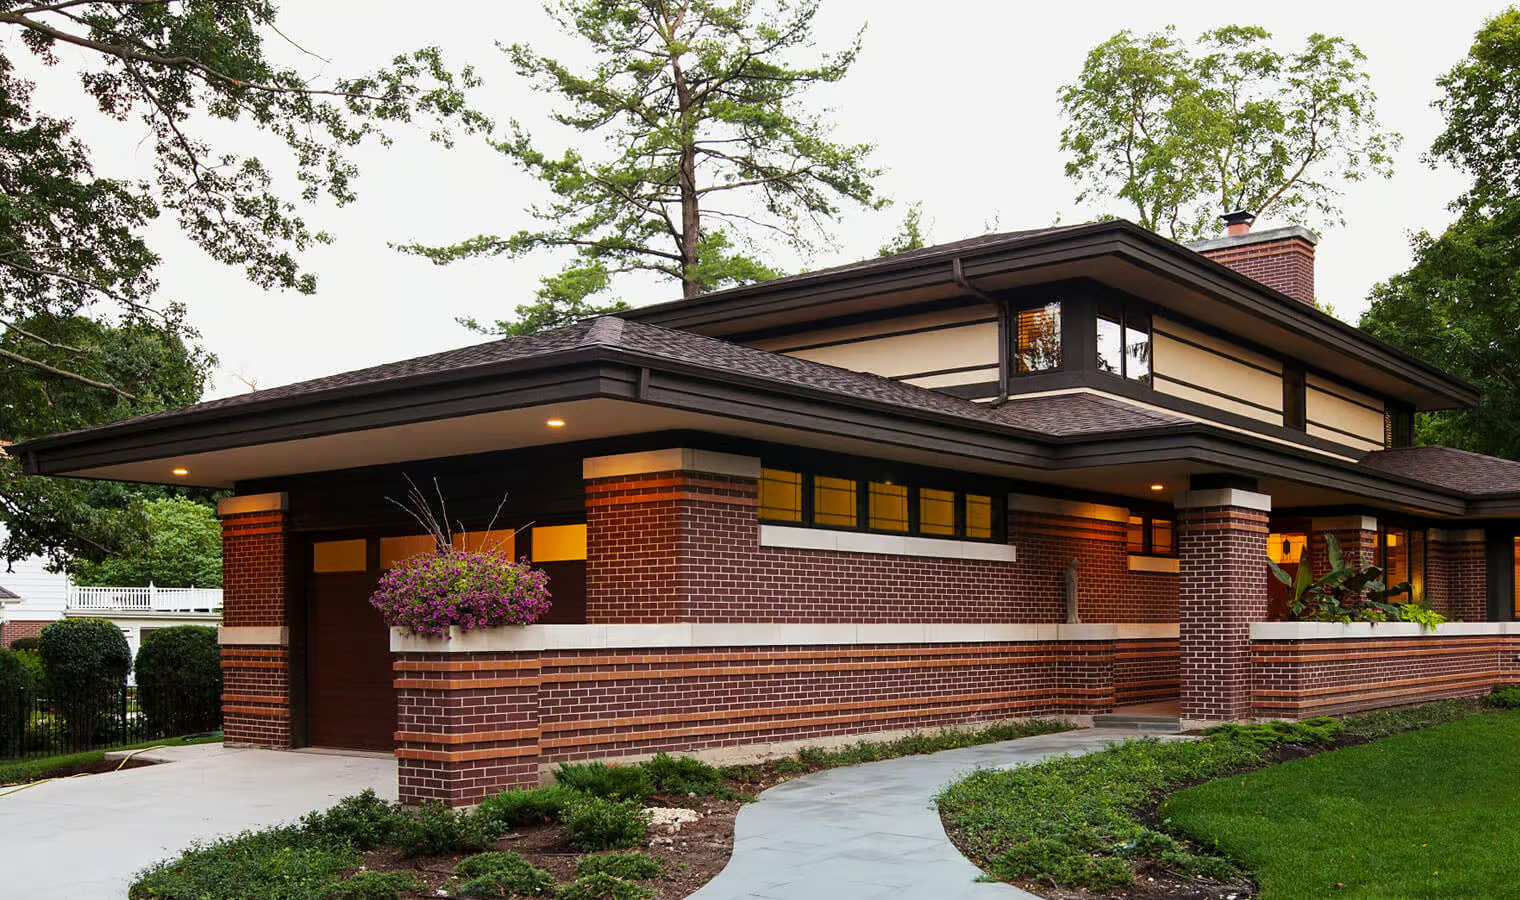
Prairie-style homes were made famous by the architect Frank Lloyd Wright. These homes celebrate and complement the natural beauty of the Midwestern landscape with low and long shapes in the floor plan and building elements.
Prairie-style houses showcase:
- Long and low-to-the-ground builds
- Flat or shallow roofs with overhanging eaves
- Thin bricks or stucco exteriors to match the house shape
- Minimalist yet stylized ornamentation
Prairie houses inspired the flat planes and natural elements popular in Mid-century houses.

There was a renewed interest in handcrafted art and design following the industrial revolution. This became the “Arts and Crafts” era and paved the way for the Craftsman home, or “arts and crafts” home.
Craftsman homes focus on simplicity to counter the ornate stylings of Victorian homes. They’re also designed to highlight the craftsmanship of its builders and include:
- A low-pitched roof with overhanging eaves
- A covered porch
- Woodwork including exposed beams and built-in features like shelving
- Natural tones to complement the warmth from woodworking
Craftsman homes are favored for their character and are another versatile style that may borrow common elements from other home styles.


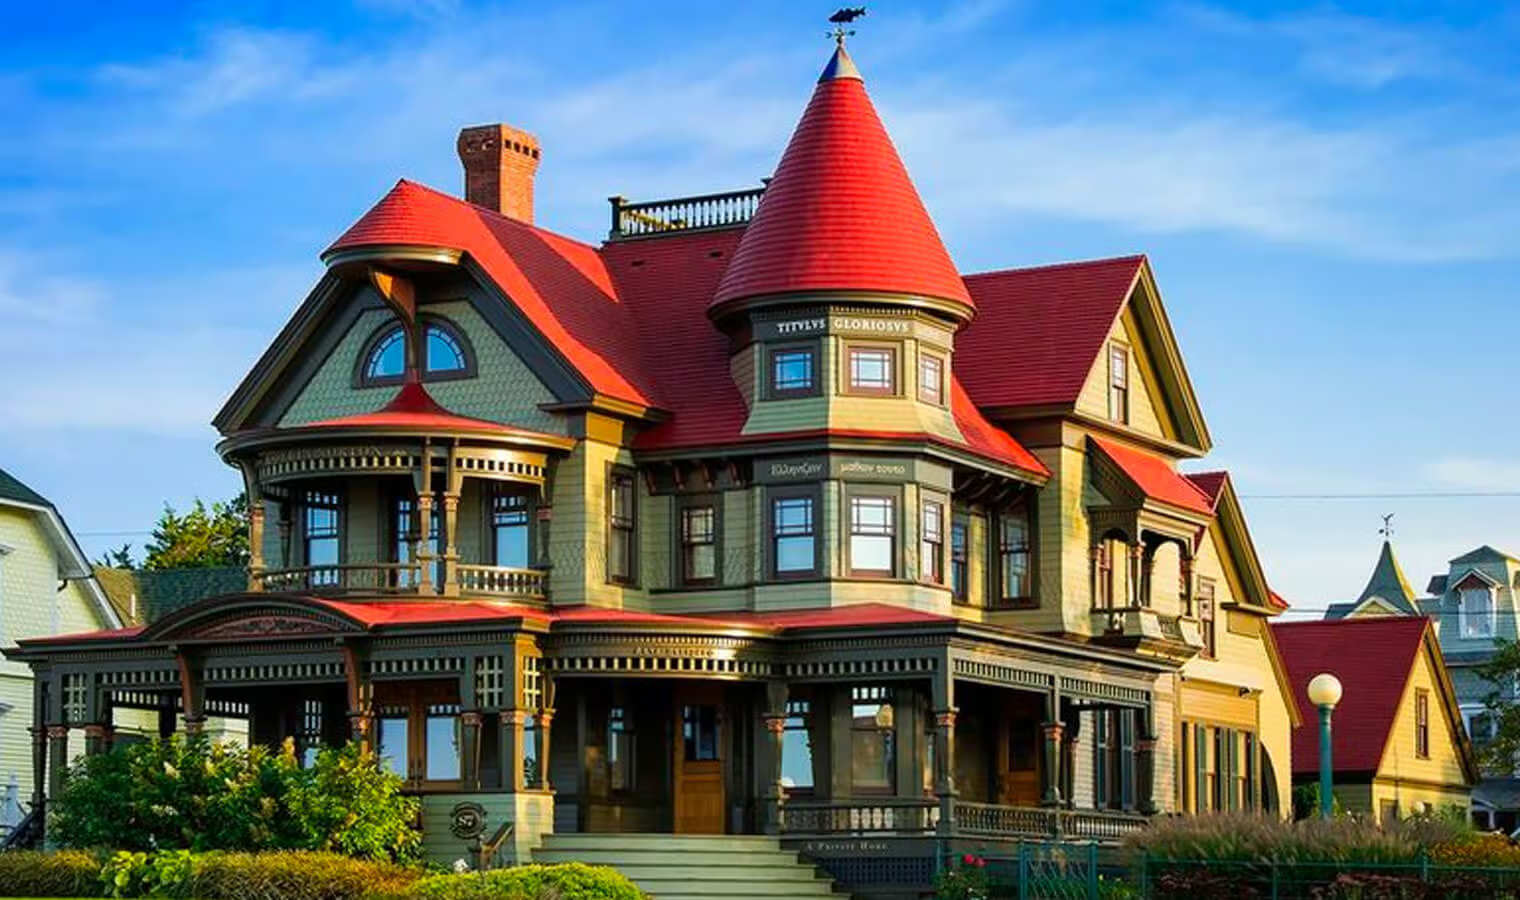
Queen Anne homes were popularized in the later Victorian era, beginning around 1880. This style is the quintessential Victorian home for many, with ornate woodworking and decor inside and out.
Queen Anne homes have key regional differences across the country, but maintain these essentials:
- Textured walls with decorative shingles or half-timbering
- Large round or polygonal tower at the home’s corner
- Steeply pitched and asymmetrical roof
- Decorative spindles on porches and trim
- Decorative single-pane or stained glass windows
Queen Anne architecture is most common in homes, but can also be seen in schools, churches, and office buildings.
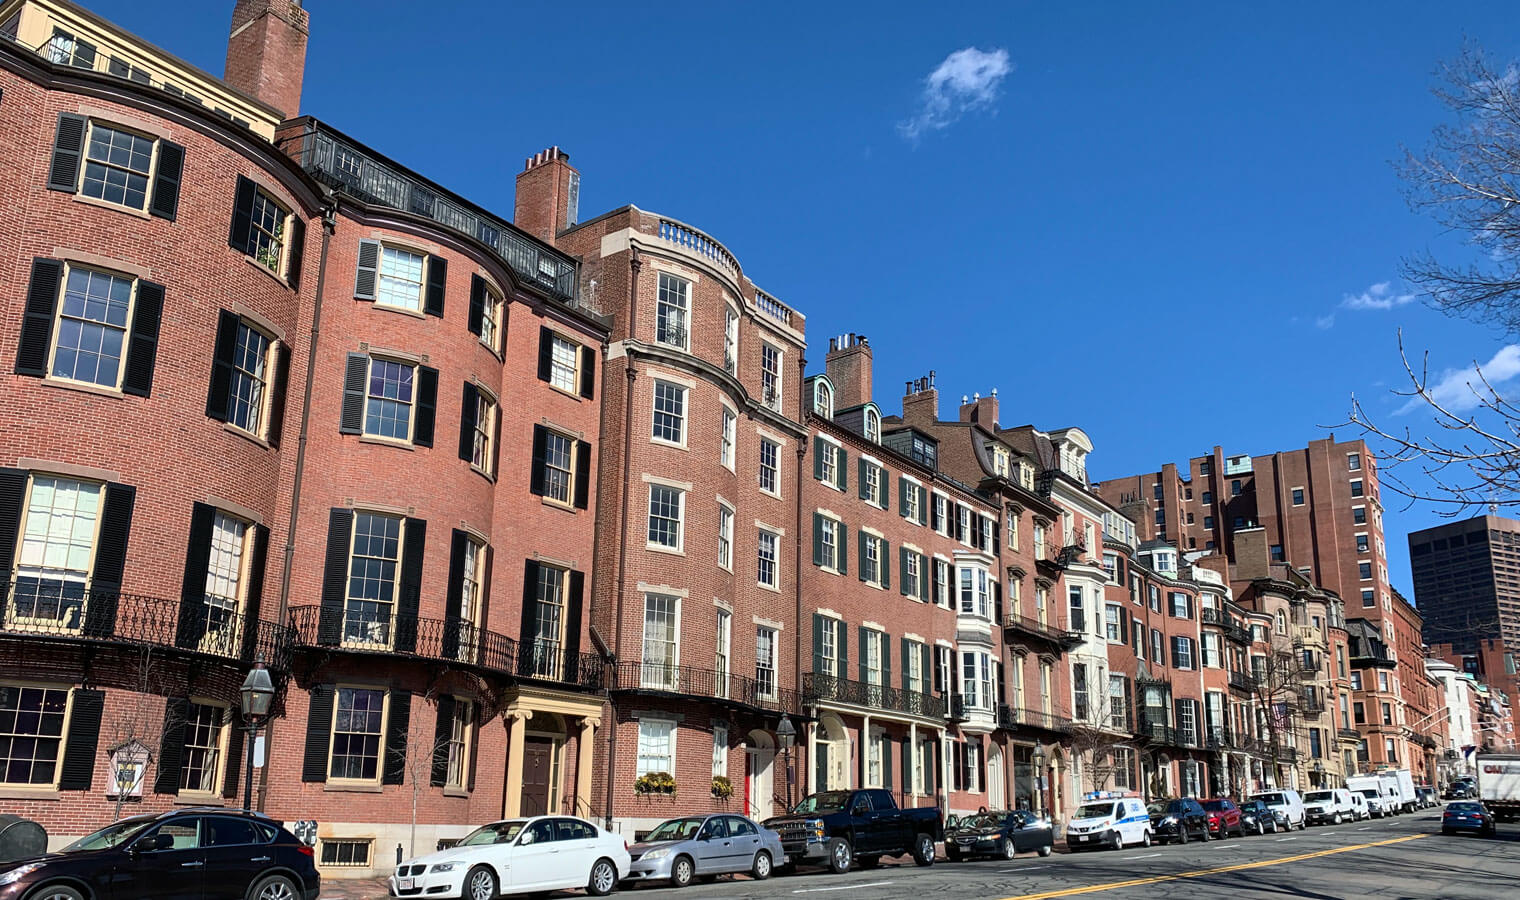
Townhomes are common in cities and densely populated neighborhoods. Townhouses are tall and narrow homes designed to make the most out of vertical space without too much of a yard or garden area.
Homes are considered townhouses when they:
- Share one or two walls with adjacent homes
- Have their own entrances
- Are built with multiple floors to maximize vertical space
- Often share a similar style to their neighbors’ homes and may operate under an HOA
Townhouses can be built to mimic other architecture styles, like Italianate and Greek Revival, while maintaining the condensed, vertical floor plan.